Dispensing activity and prescription sources
Monthly NHS activity, and which surgeries send the prescriptions.
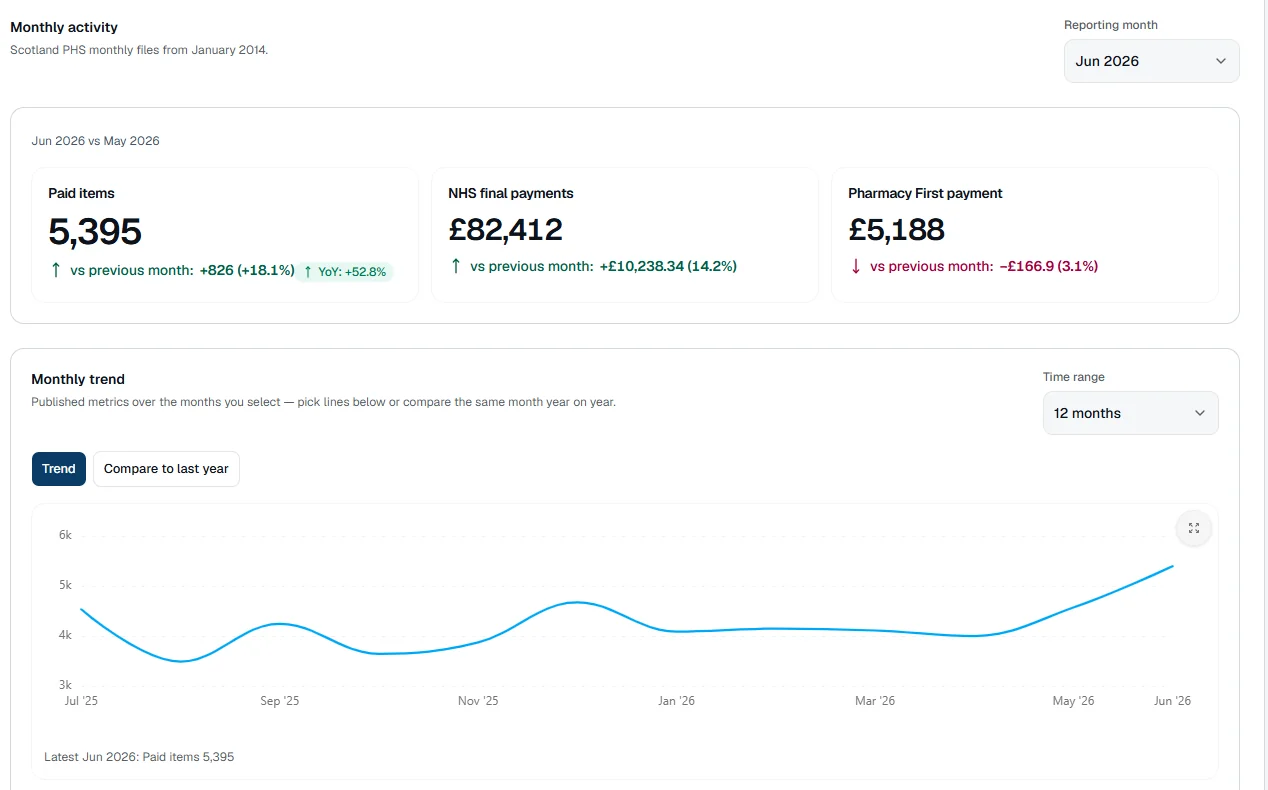
Dispensing activity
The month you pick against the month before, then a chart over the months you choose. Compare to last year lines up each month with the same month a year earlier.
In Scotland this covers paid items, NHS payments and Pharmacy First, from Public Health Scotland files back to January 2014.
Prescription sources
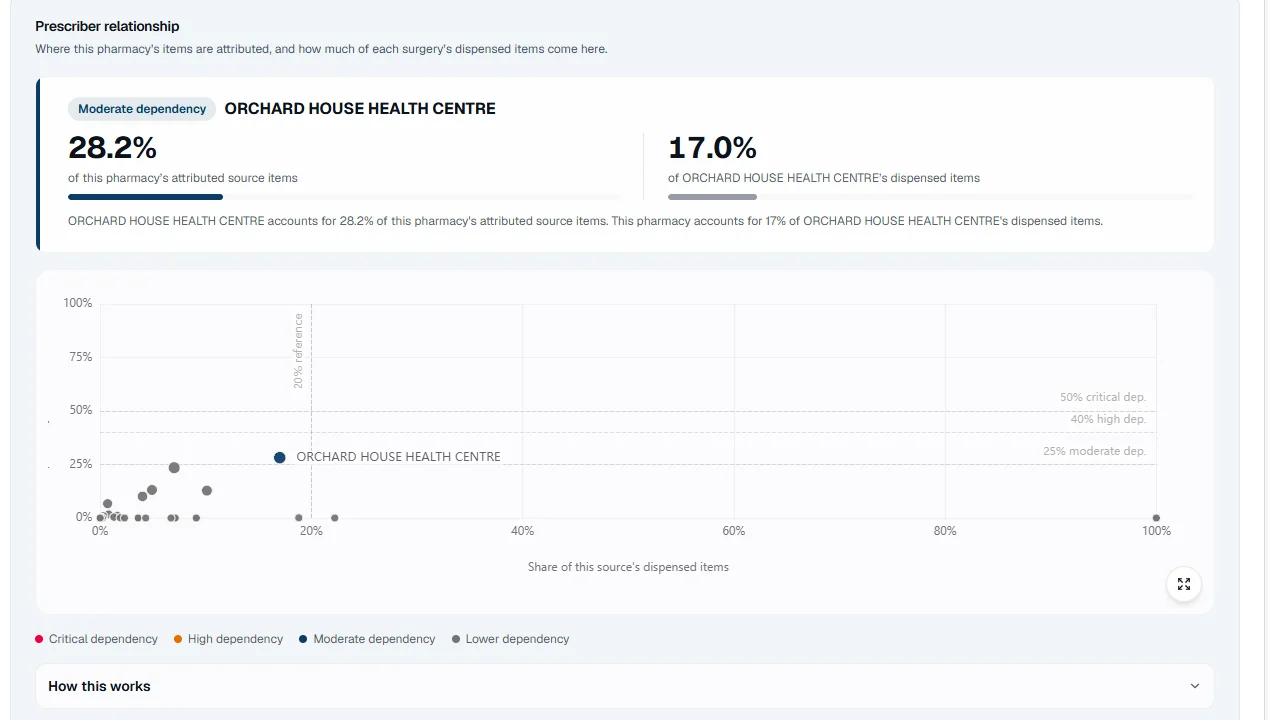
Where the prescriptions come from, and how much rests on one surgery.
- Your share: how much of this pharmacy's items come from the surgery.
- Their share: how much of the surgery's items this pharmacy dispenses.
Together they show whether the pharmacy is a surgery's main dispenser or one of several. The chart marks each surgery as lower, moderate, high or critical dependency, with lines at 25%, 40% and 50%.
Scotland includes dental practices as sources; England includes hospitals.